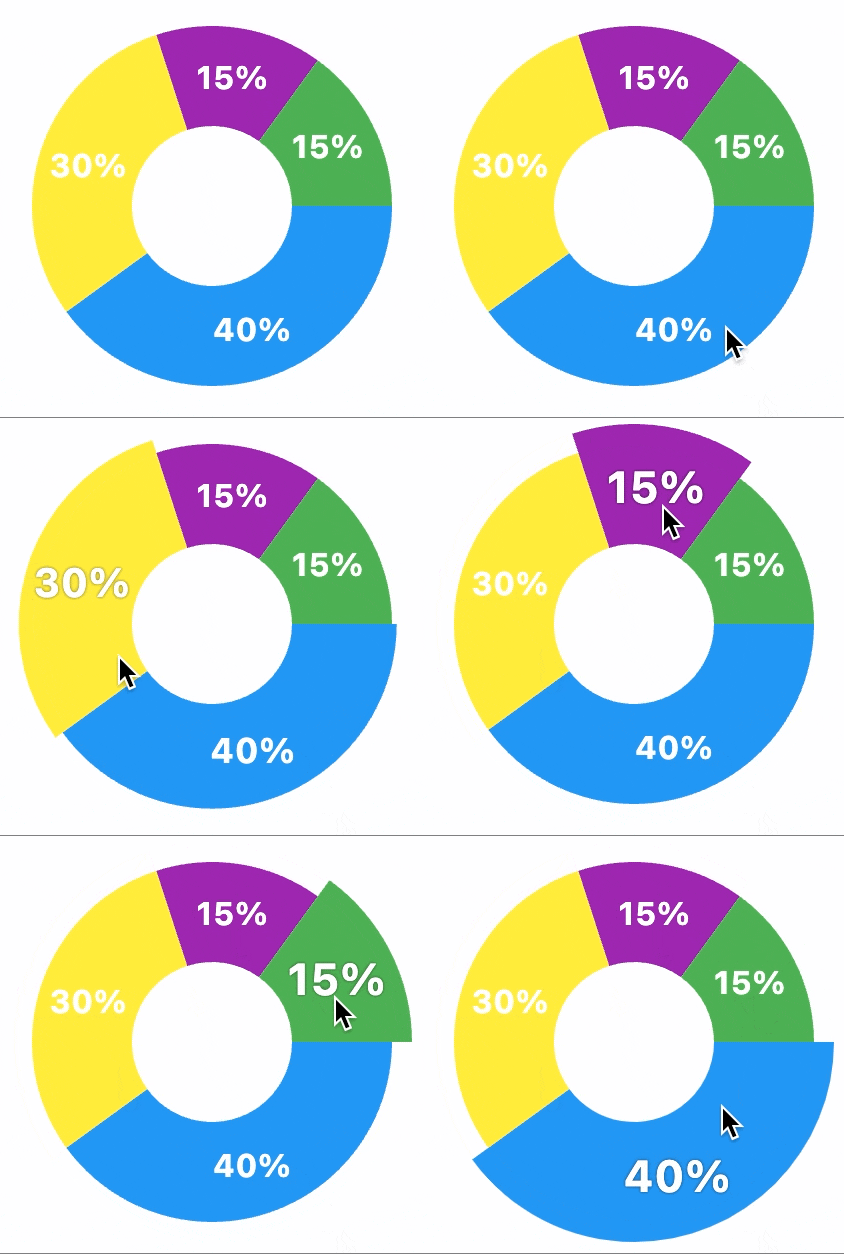
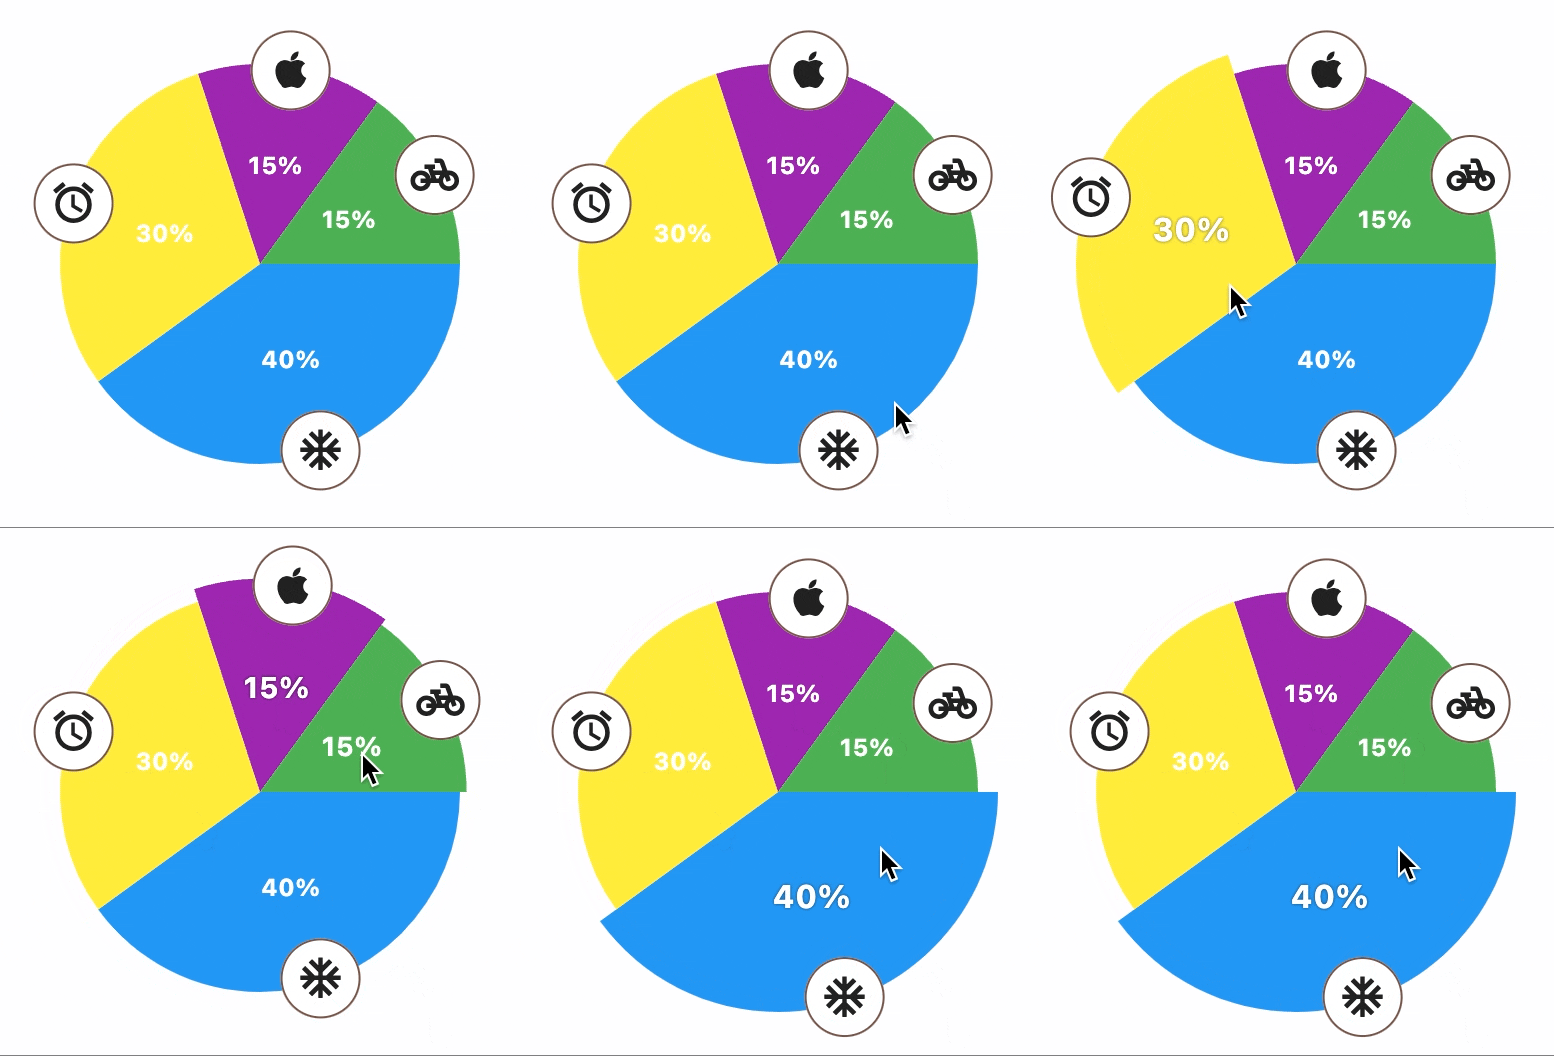
PieChart
Draws a pie chart.
Examples
PieChart 1

import flet as ft

def main(page: ft.Page):
    normal_border = ft.BorderSide(0, ft.colors.with_opacity(0, ft.colors.WHITE))
    hovered_border = ft.BorderSide(6, ft.colors.WHITE)

    def on_chart_event(e: ft.PieChartEvent):
        for idx, section in enumerate(chart.sections):
            section.border_side = (
                hovered_border if idx == e.section_index else normal_border
            )
        chart.update()

    chart = ft.PieChart(
        sections=[
            ft.PieChartSection(
                25,
                color=ft.colors.BLUE,
                radius=80,
                border_side=normal_border,
            ),
            ft.PieChartSection(
                25,
                color=ft.colors.YELLOW,
                radius=65,
                border_side=normal_border,
            ),
            ft.PieChartSection(
                25,
                color=ft.colors.PINK,
                radius=60,
                border_side=normal_border,
            ),
            ft.PieChartSection(
                25,
                color=ft.colors.GREEN,
                radius=70,
                border_side=normal_border,
            ),
        ],
        sections_space=1,
        center_space_radius=0,
        on_chart_event=on_chart_event,
        expand=True,
    )

    page.add(chart)

ft.app(main)
PieChart 2

import flet as ft

def main(page: ft.Page):
    normal_radius = 50
    hover_radius = 60
    normal_title_style = ft.TextStyle(
        size=16, color=ft.colors.WHITE, weight=ft.FontWeight.BOLD
    )
    hover_title_style = ft.TextStyle(
        size=22,
        color=ft.colors.WHITE,
        weight=ft.FontWeight.BOLD,
        shadow=ft.BoxShadow(blur_radius=2, color=ft.colors.BLACK54),
    )

    def on_chart_event(e: ft.PieChartEvent):
        for idx, section in enumerate(chart.sections):
            if idx == e.section_index:
                section.radius = hover_radius
                section.title_style = hover_title_style
            else:
                section.radius = normal_radius
                section.title_style = normal_title_style
        chart.update()

    chart = ft.PieChart(
        sections=[
            ft.PieChartSection(
                40,
                title="40%",
                title_style=normal_title_style,
                color=ft.colors.BLUE,
                radius=normal_radius,
            ),
            ft.PieChartSection(
                30,
                title="30%",
                title_style=normal_title_style,
                color=ft.colors.YELLOW,
                radius=normal_radius,
            ),
            ft.PieChartSection(
                15,
                title="15%",
                title_style=normal_title_style,
                color=ft.colors.PURPLE,
                radius=normal_radius,
            ),
            ft.PieChartSection(
                15,
                title="15%",
                title_style=normal_title_style,
                color=ft.colors.GREEN,
                radius=normal_radius,
            ),
        ],
        sections_space=0,
        center_space_radius=40,
        on_chart_event=on_chart_event,
        expand=True,
    )

    page.add(chart)

ft.app(main)
PieChart 3

import flet as ft

def main(page: ft.Page):
    normal_radius = 100
    hover_radius = 110
    normal_title_style = ft.TextStyle(
        size=12, color=ft.colors.WHITE, weight=ft.FontWeight.BOLD
    )
    hover_title_style = ft.TextStyle(
        size=16,
        color=ft.colors.WHITE,
        weight=ft.FontWeight.BOLD,
        shadow=ft.BoxShadow(blur_radius=2, color=ft.colors.BLACK54),
    )
    normal_badge_size = 40
    hover_badge_size = 50

    def badge(icon, size):
        return ft.Container(
            ft.Icon(icon),
            width=size,
            height=size,
            border=ft.border.all(1, ft.colors.BROWN),
            border_radius=size / 2,
            bgcolor=ft.colors.WHITE,
        )

    def on_chart_event(e: ft.PieChartEvent):
        for idx, section in enumerate(chart.sections):
            if idx == e.section_index:
                section.radius = hover_radius
                section.title_style = hover_title_style
            else:
                section.radius = normal_radius
                section.title_style = normal_title_style
        chart.update()

    chart = ft.PieChart(
        sections=[
            ft.PieChartSection(
                40,
                title="40%",
                title_style=normal_title_style,
                color=ft.colors.BLUE,
                radius=normal_radius,
                badge=badge(ft.icons.AC_UNIT, normal_badge_size),
                badge_position=0.98,
            ),
            ft.PieChartSection(
                30,
                title="30%",
                title_style=normal_title_style,
                color=ft.colors.YELLOW,
                radius=normal_radius,
                badge=badge(ft.icons.ACCESS_ALARM, normal_badge_size),
                badge_position=0.98,
            ),
            ft.PieChartSection(
                15,
                title="15%",
                title_style=normal_title_style,
                color=ft.colors.PURPLE,
                radius=normal_radius,
                badge=badge(ft.icons.APPLE, normal_badge_size),
                badge_position=0.98,
            ),
            ft.PieChartSection(
                15,
                title="15%",
                title_style=normal_title_style,
                color=ft.colors.GREEN,
                radius=normal_radius,
                badge=badge(ft.icons.PEDAL_BIKE, normal_badge_size),
                badge_position=0.98,
            ),
        ],
        sections_space=0,
        center_space_radius=0,
        on_chart_event=on_chart_event,
        expand=True,
    )

    page.add(chart)

ft.app(main)
PieChart properties

animate
Controls chart implicit animation.
The value is of AnimationValue type.
center_space_color
Free space color in the middle of a chart.
center_space_radius
Free space radius in the middle of a chart.
sections_space
A gap between sections.
start_degree_offset
By default, sections are drawn from zero degree (right side of the circle) clockwise.
You can change the starting point, by setting start_degree_offset (in degrees).
sections
A list of PieChartSection controls drawn in a circle.
PieChart events
on_chart_event
Fires when a chart section is hovered or clicked.
Event data is an instance PieChartEvent.
PieChartSection properties
value
Determines how much the section should occupy. This depends on sum of all sections, each section should
occupy (value / sumValues) * 360 degrees.
radius
External radius of the section.
color
Background color of the section.
border_side
The border around section shape.
Value is of type BorderSide.
title
A title drawn at the center of the section. No title is drawn if title is empty.
title_style
The style to draw title with. The value is an instance of TextStyle class.
title_position
By default title is drawn in the middle of the section, but its position can be changed
with title_position property which value must be between 0.0 (near the center) and 1.0(near the outside of the pie
chart).
badge
An optional Control drawn in the middle of a section.
badge_position
By default the badge is drawn in the middle of the section, but its position can be changed with badge_position
property which value must be between 0.0 (near the center) and 1.0(near the outside of the pie chart).